One of the greatest challenges in performing 3D geotechnical numerical analysis is in creating a model of the geometry of a particular site. A well-defined model that accurately represents the site topography and boundaries of material layers is essential to producing an accurate analysis. The traditional approach of creating a numerical model and evaluating the stability based on a 2D profile does often not lead to a comprehensive analysis of the slope stability of the structure. A 3D factor of safety (FOS) can provide the design engineer with additional insight into the estimated performance of highly 3D geotechnical structures such as tailings dams.
This success story presents a real-world analysis of a complex tailings dam analysis as built and utilized by BGC Engineering Inc. to determine the appropriateness of the design of a new tailings dam structure. Complex design requirements are integrated with underlying geostrata to provide a comprehensive digital twin 3D model. The numerical model is created with the PLAXIS Designer software and analyzed in the PLAXIS LE software.
Why build a 3D Model
Use of 2D LEM models for assessing the stability of real-world slopes is based on two assumptions:
• Plane strain conditions are assumed: all slope strain occurs within the plane of the section.
• The geometry of the section is sufficiently similar either side of the cross section, so that out of plane geometry has limited effect on the result.
In the case of many tailings dams the above two assumptions are not met. The lithology of the foundation, geometry of the dam and/or position of the water table can vary across the site resulting in 2D section geometries that can vary significantly with small adjustments in the section’s position. These variations can also make it difficult for experienced engineers to anticipate the critical sliding locations and direction and thus making it difficult to align the strains occurring in the section with the strains of the true failure.
Therefore a 3D model is needed in order to meet the requirements for proper analysis of a tailings dam at a particular site.
Building a 3D Model - PLAXIS Designer
The 3D model was built entirely within PLAXIS Designer. Pre-development LiDAR was used to define the both the topographic surface and translated down to bound the bottom of the controlling soil layer in the simplified geology. A DXF surface of the digitized foundation approvals were imported and intersected with both the topographic and subsurface surfaces to replicate excavation of the foundations. The foundation approval surface was also used to create the blanket filter surfaces by translating the surface up the width of the filter and trimming it to the filter extents. As-built dam geometries we imported from SurpacTM and AutoCADTM with surface mesh refinement editing Performed. Future design stages were either extruded from 2D neat line sections or imported directly from AutoCAD.
Slope Stability Analysis - PLAXIS LE
In the case of US stability at the bend in the abutment, 2D sections could not reasonably resolve the pseudo-static seismic stability and a 3D stability model was required. To analyze the LEM slope stability analysis in 3D, the software PLAXIS LE was used which is integrated with the PLAXIS Designer conceptual modeling software, providing an improved interaction between geometry building and analysis in the final solution.
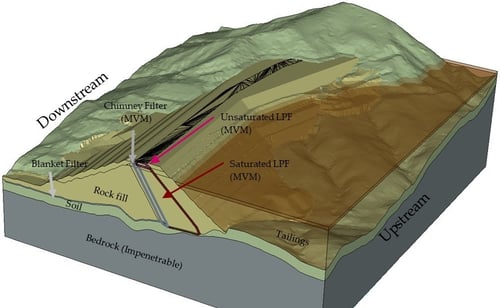
Figure 1: 3D Model of Dam 1, exterior surface for MVM of LPF and Chimney Filter shown
RESULTS AND DISCUSSION
As shown in figure below, the 3D Slope Stability illustrates the slope failure shape for an US analysis using the Morgenstern-Price calculation method and Figure 5 the 2D Slope Stability under the same seismic condition of the 3D model. The 2D cross section for analysis was located at the bend inflexion point.
The comparison between 2D and 3D analysis is useful in the context of professional geotechnical design.
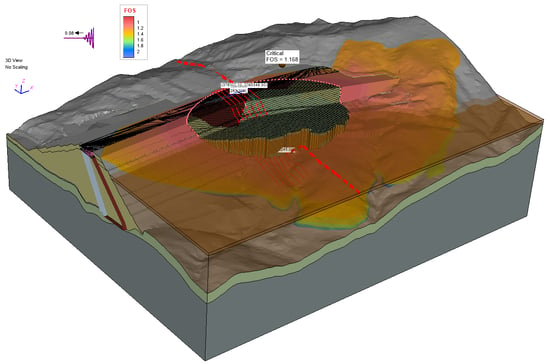
Figure 2: 3D Slope Stability Analysis - US Result Under Pseudo-Static Seismic Condition, Dashed Red line indicates location section cut for 2D analysis.
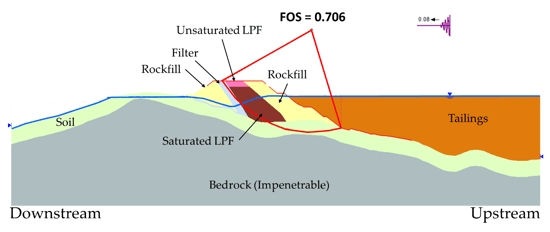
Figure 3: 2D Slope Stability Analysis - US Result Under Pseudo-Static Seismic Condition, Orange is Tailing, Light green is Soil, dark grey is bed Rock (impenetrable). Marron is the compacted clay core, Light grey is chimney and blanket filters. Yellow is rock fill.
Learn more about PLAXIS with Virtuosity:
Learn 6 Reasons Why You Should Use PLAXIS for Geotechnical Analysis Project. Read here
Get to know BENTLEY IoT Geotechnical Stability Capabilities here.
For the price and the amount of Keys included in PLAXIS Virtuoso Subscription, please visit PLAXIS.
Interested in this topic but didn't find the answers you are looking for? Contact a PLAXIS expert now. We are here to help.