A key input to a water distribution system model is the demand assigned to locations in the system. For most of the history of modeling and most models today, these demands are based on a known volumetric flow rate. Some, however, would argue that all water leaves the system through some kind of pressurized orifice and demands should be modeled as pressure-dependent. Software today, like OpenFlows WaterGEMS, has the ability to model demands as volume-based or pressure-dependent.
One side in this issue maintains that pressure in most water systems does not vary greatly, and therefore the effect of pressure on demand is less than the uncertainty in the demands themselves. While this is generally true, in intermittent water systems in developing countries, the pressure can vary from a maximum to zero hour-to-hour, day-to-day and instantaneous demand is completely dependent on pressure.
Flow vs Pressure Graph
A good way to look at the problem is with a graph of flow vs. pressure, as shown below. Most modelers use the red line, where the demand is independent of pressure as long as the node is connected to a source. The red line can move up and down based on time of day and other factors, but is always flat.
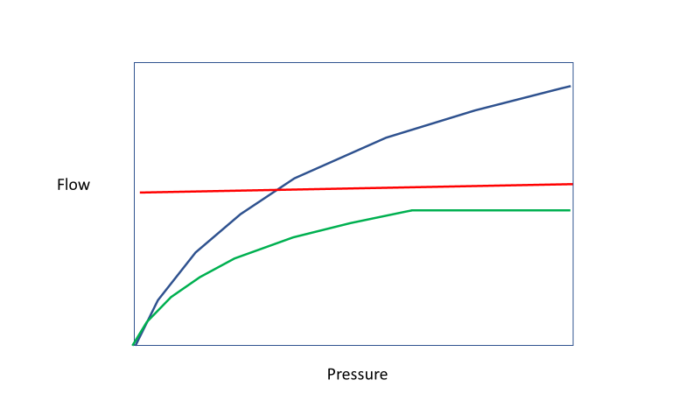
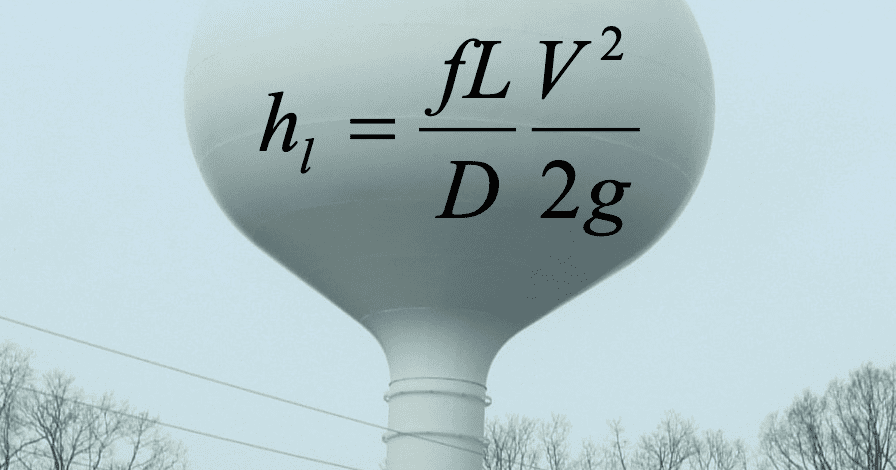
Those subscribing to pressure-dependent demand (PDD) say the blue line is correct. It is mathematically described by an orifice equation along the lines of
Q = a P b
Where Q is flow, P is pressure, a depends on the size of the orifices assigned to the model node and b is generally 0.5, although there are cases where leaks can actually stretch the orifice size and b would be greater than 0.5.
OpenFlows WaterGEMS allows the user to use an equation like the one above, but also allows the user to specify any piecewise linear, non-decreasing function.
Then there are those who say that above a certain pressure, demand is independent of pressure but up until that point, demand is a function of pressure. This is the green line above. In WaterGEMS, we call that point a pressure threshold. It is hard for me to think of any individual plumbing fixture that behaves like this, but this function can be useful for some studies.
The truth of course lies somewhere between these curves, and we may never know. With modern AMI meters that can measure flow and pressure to develop curves for individual fixtures, but a dishwasher is different from an ice maker, which is different from an irrigation sprinkler. So, how do you generate a curve for a customer?
The type of demand function depends on the type of orifice being used. A few years ago, Orazio Giustolisi and I wrote a paper attempting to classify all water demands (Giustolisi and Walski, 2012). After much discussion, we arrived at four different types of demands (if you count leaks as a demand). This paper has been widely cited since it was published. The four demand types are:
- Volume-based. This type includes bathtubs, dishwashers, washing machines, tank-type toilets. Although these tanks fill at a different rate depending on the pressure, when you aggregate the demand over a node (or a system), the volume and flow rate are independent of pressure (as long as it is non-zero). Traditional volume-based demands work well.
- Controlled pressure-dependent demands. This includes showers, faucets, and garden and fire-fighting hoses. The demand for this is based on both pressure and degree of opening, which is controlled by the customer/firefighter. The fixture sets the upper limit but in many cases, the fixture is not open fully. Do you open the faucet fully when you brush your teeth? It is very difficult to assign a flow on a use-by-use basis but overall, they can be reasonably approximated by volume-based demands. This type of demand becomes more important when you get into modeling premise plumbing, where individual orifices can interact with one another and the degree of opening is human-based. Hydrants opened during flushing or flow tests can be considered in this category, but they only flow for short periods.
- Fixed orifice demands. These orifices are generally not adjusted. They are either on or off. Irrigation sprinklers and fire sprinklers, and flow-valve toilets and urinals are examples of these orifices which are seldom throttled. These can best be modeled as pressure-dependent demands the fixtures can interact with one another.
- Open orifices. This is the only purely pressure-dependent demand. The only example I can think of is leaks. Of course, if the pressure is constant in the area of the leaks, these can also be approximated by volume-based demands.
The answer to the question raised in the title is “four”. For any individual orifice at any given point in time, flow is dependent on pressure. However, modelers don’t know exactly who is watering their lawn or flushing their toilet at any given time. In most cases, volume-based demands can provide a reasonable approximation. The exceptions are situations where pressures will vary widely, which can include cases where the opening of an orifice can significantly affect the pressure at other nearby orifices.
Learn more about OpenFlows WaterGEMS.
For guidance on how to use PDD in WaterGEMS, see: https://communities.bentley.com/products/hydraulics___hydrology/w/hydraulics_and_hydrology__wiki/2671/using-pressure-dependent-demands
Giustolisi, O. and Walski, T. 2012, “Demand Components in Water Distribution
Network Analysis,” Journal of Water Resources Planning and Management, Vol. 138, No. 4, p. 356-367.
Want to learn more from our resident water and wastewater expert? Join the Dr. Tom Walski Newsletter today!