
Disinfectants like chlorine and chloramines work by oxidizing chemicals and microbes in the water, and that’s why we use them. The problem is that by doing their job, their concentration decreases, and it’s possible to end up with low or zero levels of disinfectant residuals. You can’t continuously monitor residuals everywhere in your system. Your OpenFlows WaterGEMS and OpenFlows WaterCAD models can help you determine residual disinfectant levels throughout the system, identify problems and develop approaches to maintain residuals such as changing dosing, switching disinfectants, adding booster stations, flushing, and blowoffs, …
Disinfectant decay is not a simple process. A lot is going on. We do a good job approximating these complex reactions by lumping them into two overall processes – bulk fluid decay and wall reactions. In a model, this involves specifying a bulk decay rate kb and a wall reaction rate kw.
The most common question we get is, “What reaction rates should I use?” That question is a lot like asking, “How long is a string?” Every source water and pipe network has different reaction rates. Distilled water has reaction rates close to zero, while dirty water will have disinfectant concentrations go to zero instantly.
There was a good paper in a recent issue of Urban Water Journal (Vol 18, No. 7, p 510-519), “Bulk and pipe wall chlorine degradation kinetics in three water distribution systems” by McGrath et al. from the University Laval in Quebec. They did extensive monitoring for three systems in Quebec, and their literature review highlighted other studies. Here is a summary of the values they reported:
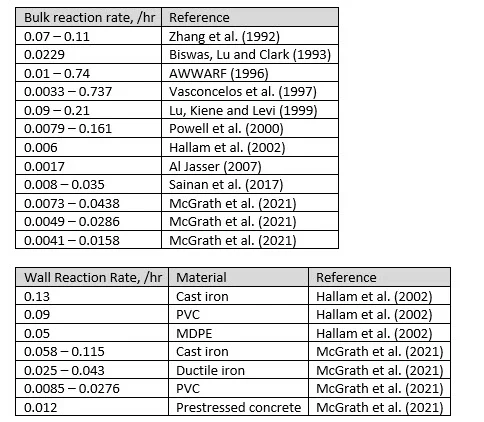
The primary takeaway from these tables is that there is no such thing as a “typical disinfectant reaction rate.” The variation in rates is dramatic. The primary differentiators are water quality, pipe material, and temperature. The temperatures were not always specified for the bulk reaction rate listed, although usually 20 deg C is a recommended value.
There is no single parameter that can be used as an indicator of water quality, although parameters like total organic carbon might be a good surrogate. For wall reactions, it is difficult to isolate sections of a distribution system with homogeneous wall material, and it’s difficult to quantify the impacts of biofilms.
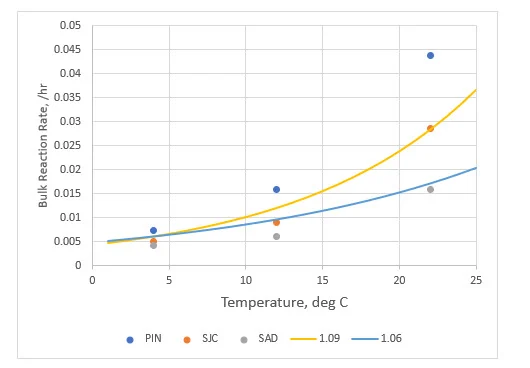
One of the key drivers for variations in reaction rates is temperature. McGrath’s Quebec data had bulk reaction rates for different temperatures. I was able to take the data and fit it to a convenient form of the van’t Hoff-Arrhenius Equation and came up with the following equation.
kb2=kb1 θ(T2-T1)
Where Kb2 = bulk reaction rates at Temperature T2, /hr; Kb2 = bulk reaction rates at Temperature T2,, /hr; Θ= coefficient
I did some analysis for values of Θ and settled on 1.08, which seems a bit high to me. I wouldn’t put too much faith in that value, but here is what the data look like graphically. (PIN, SJC, SAD refer to code names for the systems.)
Given the huge range of disinfectant reaction rates published in the literature, it would be foolish to simply pick a rate and use it. You need a value that is current for your system. You can directly measure the bulk reaction rate in a lab study for a specific sample under a controlled temperature. The detailed steps were documented by Walter Grayman on page 165 of AWWA Manual 32, “Computer Modeling of Water Distribution Systems.”
There is no test to directly measure wall reaction rates. Instead, wall reaction rates are used as calibration parameters in a model. Given a collection of disinfectant samples through a system, accurate bulk reaction rates, and an extended period hydraulic model, you would initially assume a wall reaction rate of zero. Run the model, and if there are significant wall reaction rates, the field measurements of residual will be lower than model prediction. In that case, you would estimate the wall rate and keep adjusting it until the model agrees with the field data.
Remember that reaction rates can change seasonally due to different levels of natural organic material in the source water or even due to sediment for a heavy precipitation event. It is good practice to conduct a sensitivity analysis to determine the impact of varying reaction rates.
If you want to look up past blogs, go to https://blog.bentley.com/category/hydraulics-and-hydrology/. And if you want to contact me (Tom), you can email tom.walski@bentley.com.
Want to learn more from our resident water and wastewater expert? Join the Dr. Tom Walski Newsletter today!