EMME multimodal transport planning software helps cities, planning agencies, infrastructure owners, and mobility providers improve planning decisions by evaluating and forecasting transport system performance.
EMME includes an interactive and animated 3D mapping environment called EMME Scenes which was developed to help you better understand your travel models and improve transport planning decisions. Seeing models in new ways can bring new insights, especially when they are sufficiently easy to produce from a travel model. EMME Scenes represents another step forward in our journey to portray a more comprehensive and accurate representation of urban mobility.
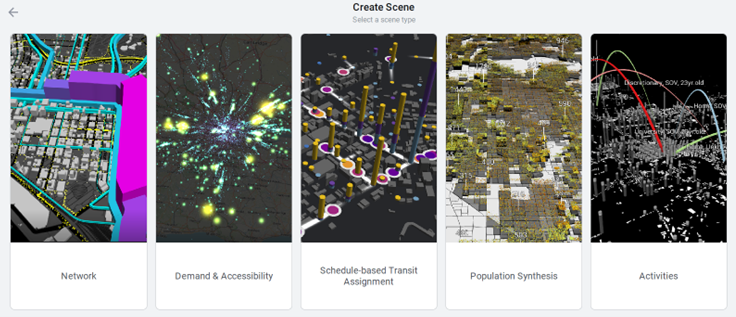
EMME makes it easy to produce a variety of scenes using the model data in your projects. In this blog post we’ll provide some context and application for some of the most popular scene types.
Disclaimer: The examples below were produced for illustrative purposes only and do not directly reflect data that has been used or approved for planning purposes in any way by any party, stated or otherwise.
Animated Network Scenes
Traditional bandwidth plots don't show movement or time even though the traffic results produced by most travel models represent link-level traffic flow rates and speeds. You can conveniently visualize these aspects simultaneously from any existing travel model using the Traffic Flow layer in the Network scene. In the example here, traffic flow animation is shown against extruded 3D bandwidth plots of transit volumes. Notice how you can discern differences in traffic speed, number of lanes and even volume/capacity ratio between freeways, arterials or different parts of the network.
Almost all travel models today include at least some kind of time-of-day choice, at the very least to treat AM, midday, and PM periods differently. And some network models, such as the space-time traffic assignment in EMME, produce explicit temporal results across time periods. With EMME Scenes you can easily animate network values across time periods, across scenarios, or even to show ranges of response from sensitivity testing your model parameters or inputs. In the next example, hourly traffic flows are animated over the course of 24 hours. Notice how the commute direction change is clearly visible in and out of the Central Business District (CBD) between the morning and evening. Values are interpolated smoothly between 1-hour periods, but this can be configured to your preference.
Note also how 3D text labeling works so you can see quantitative values in addition to styles and symbols, and how the text also participates in the animation. When you take a top-down view in EMME Scenes you can replicate the effect of 2D bandwidth plots, but the choice is up to you. EMME Desktop worksheets let you save views, print to image, SVG and PDF, and write scripts to automate repetitive reports, while EMME Scenes lets you create storyboards with animated keyframes and record video.
Activity Scenes and Activity-Based Travel Model (ABM)
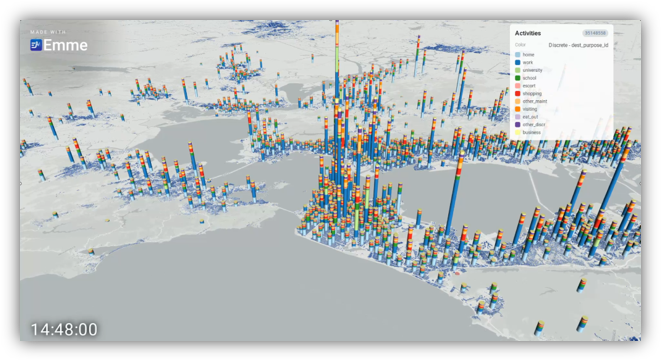
As travel demand models advance from zonal aggregate representations to microsimulation of individual travel choices, they produce more information than ever before, in some cases including all the tours, trips, and travel made by a synthetic population to complete daily activities such as work, education, shopping and recreation across the model region. For example, an activity-based travel model (ABM) for a major US metropolitan region run at a full (100%) sample might include over 25 million trips made by 8 million inhabitants over time and space.
Conventional maps for zonal aggregate travel models were not originally designed for this detail. But, using the Activities scene, you can leverage all the details of activities, tours, trips and individuals in your AGENT travel scenario to provide a complete and interactive visual representation of urban mobility.
Using the Trip Tracing layer of the Activities scene lets you further drill-down to focus on an individual within a household to reveal daily activity sequences, such as this case for a middle-aged worker who completes work and escort (chaperone) activities before returning home. When using demand microsimulation, it is essential that modelers can leverage such tools to validate travel choices and explore model response.
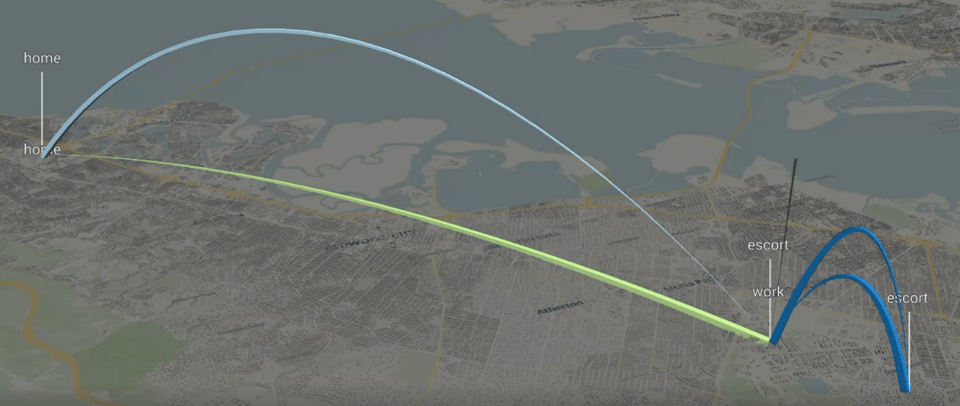
Both the population movements and trip tracing simulation playback modes of the Activities scene are useful for supporting specific planning analyses and detailed model inspections that are required to build confidence in activity-based model results.
Schedule-Based Transit Assignment Scenes
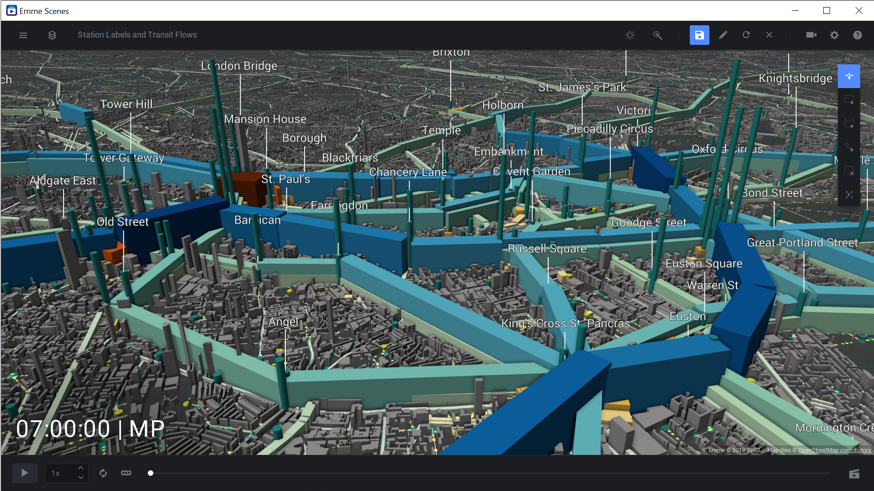
EMME includes a schedule-based transit assignment procedure which has been upgraded to work with crowding so that it is suitable for transit service planning applications in high-frequency, urban settings. There is an enormous amount of information in a day's worth of timetable itineraries for a metropolitan region and more so when you consider results such as boardings, alighting's, and ridership details, all of which can be animated easily using EMME Scenes.
Quick tip – You can use the Schedule-based Transit Assignment (SBTA) Scene to animate General Transit Feed Specification (GTFS) transit information. Use the Import Schedule from GTFS tool to import transit schedules, run a schedule-based transit assignment on the imported services, and use the SBTA Scene as an easy way to visualize your GTFS schedules.
Get Started Today!
With EMME 2023* you can get started today with any of the scenes described here or explore others such as the Demand and Accessibility scene which uses animation to visualize travel demand O-D matrices at scale, or the Population Synthesis scene which lets you illustrate socioeconomic values of synthetic populations at any zonal level.
If you want to have a go at creating your own animations from your own mobility data sets in a Python data science environment, you can do so with CityPhi, a mobility animation studio for data scientists.
Get started with Scenes today using the latest version* of EMME.
*Latest version at time of publishing is EMME 2023.