

Slope stability analysis is a commonly performed type of analysis in the geotechnical profession. Such analysis is typically performed using laboratory-measured shear strength properties and the geometry from design drawings. This analysis may include an approximate specified water table. Slope stability analysis is somewhat disconnected from the field information collected from piezometers and CPT data. Disconnections to field data can be problematic as pore-water pressure changes are the most common cause of slope stability issues in earth structures worldwide.
The traditional analysis of slope stability is performed as a 2D plane strain profile. The analysis of the majority of larger hydropower dams, tailings dams, open pits, and other large earth structures has been shown to be improved through the use of 3D analysis techniques. Bentley’s geotechnical applications, like PLAXIS LE is on the forefront of such 3D analysis techniques and implements the most advanced 3D stability analysis software currently available. The PLAXIS LE software has been proven on the forensic analysis of the Mt. Polley, Cadia, and Feijao failures as well as pioneering the analysis of complex tailings dams such as the one shown in Figure 1. The software specializes in the analysis of complex 3D geometry and has elevated the numerical modeling level of practice in the field of 3D limit equilibrium geotechnical stability modeling.
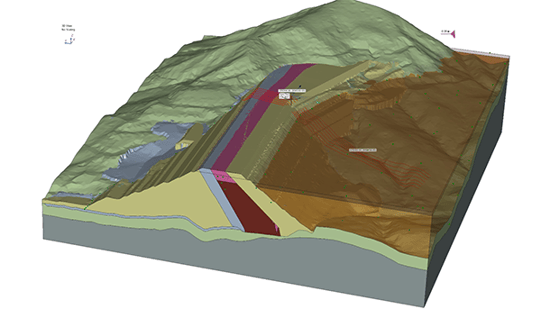
Figure 1 Stability model of complex tailings dam
Bentley has partnered with sensemetrics in order to allow integration of cloud time-based sensor data. The integration has resulted in changes to Bentley applications and the end result is improved seepage and stability analysis that is highly integrated with field data obtained from the sensemetrics cloud.
Such integration enables the following specific capabilities in the software:
PLAXIS Designer
The PLAXIS Designer software implements menu functionality to allow the user to connect to the sensemetrics cloud. The user can then see the relevant instrumentation data availability and select a date range to synchronize to the local workstation. Each time the PLAXIS Designer software is opened, it looks to the cloud for additional or changed data to synchronize with the local workstation. The PLAXIS Designer application allows visualization of the data over time and in the context of 3D space. This enables further interpretation of the field data in an improved manner. The following specific features are enabled in PLAXIS Designer:
i) Download of date ranges of piezometer data
ii) Visualization of water level changes over time as “disks” at measured head plotted around each piezometer
iii) Download of CPTu measurement data
iv) Visualization of CPTu data as “cones” indicating pressure head readings at various depths
v) Download of topography (and other) files for visualization.
vi) Interpolation of global water table at a specific point in time.
vii) Interpolation of 3D pore-water pressure field of values for export to a slope stability or seepage model.
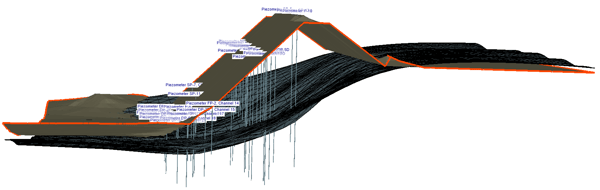 Figure 2 Visualization of piezometer locations and water table in PLAXIS Designer
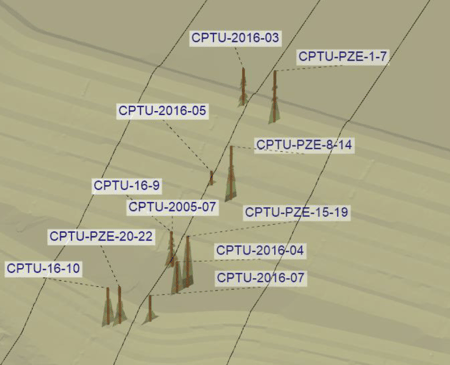
Figure 3 Visualization of CPTu data & pressure vs. depth readings in PLAXIS Designer
PLAXIS LE
The PLAXIS Designer conceptual model can be transferred to the PLAXIS LE software for limit equilibrium stability analysis in 2D or 3D. The pore-water pressures can be transferred into PLAXIS LE as either a 3D water surface where pressures are assumed to be hydrostatic above and below the water table, or as a 3D interpolated field of pore-water pressures. The pore-water pressures are then included in the stability calculations of a single or a multi-plane (MPA) spatial analysis.
i) Import of pore-water pressure conditions from PLAXIS Designer as a water surface or 3D field of values.
ii) The pore-water pressures (from piezometers or CPTu data) can be utilized in the factor of safety calculations directly.
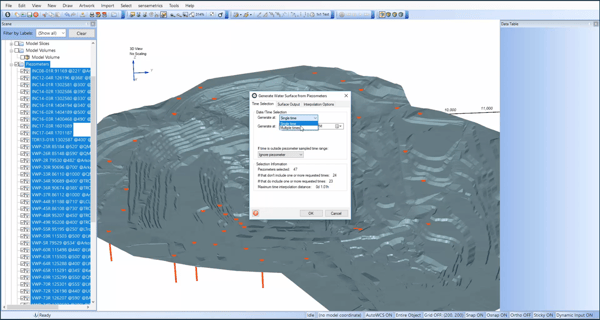
Figure 4 Example open pit in PLAXIS Designer with piezometers synchronized with the sensemetrics cloud identified in red
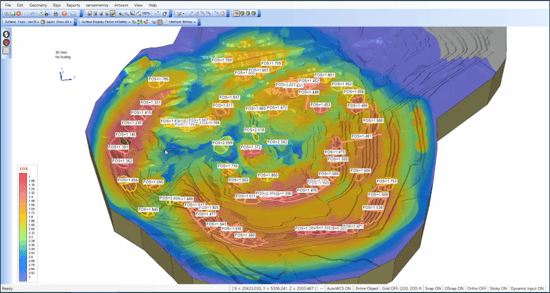
Figure 5 The "heat map" results of a MPA stability analysis can be subsequently uploaded to the sensemetrics cloud
Finite Element Groundwater Seepage
The PLAXIS LE software can import geometry, water tables, and CPTu data in order to form the initial conditions of a transient seepage model run. The software can also import field piezometer/CPTu values to compare to modeling results for calibration purposes.
i) Import of pore-water pressure conditions from PLAXIS LE as a water surface or 3D field of values. Such an import can be utilized as initial conditions for a transient seepage model.ii) Imported field-measured pore-water pressures can be compared to pore-water pressures calculated by the finite element model.
PLAXIS LE has illustrated analysis of complex layering of tailings determined by CPT data as well as the integration of piezometer and CPTu data in the calibration process in the Feijao seepage analysis (Figure 2)
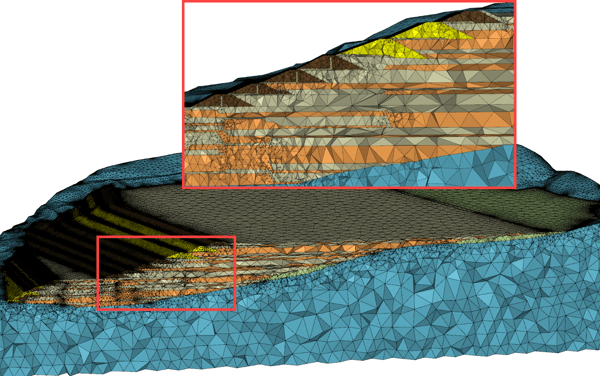
Figure 6 3D seepage model developed for the Feijao forensic analysis
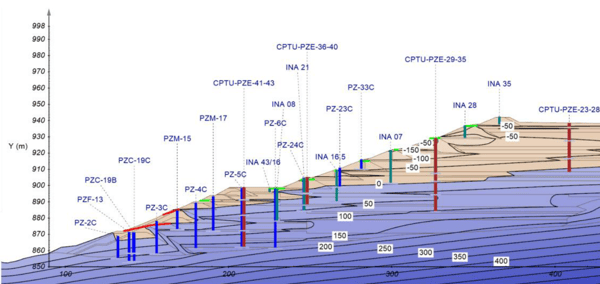
Figure 7 Calibration of pore-water pressure contours to piezometer measurements
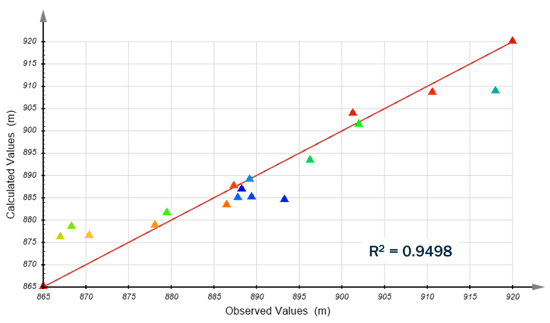
Figure 8 Correlation between pore-water pressure head measured in the field and calculated in the model
CLIENT OPPORTUNITY
There are significant improvements in data management, visualization, and integrated 3D slope stability analysis which can be realized from the combined sensemetrics + Bentley’s PLAXIS software platform. Closer integration between field and model data as well as the 3D abilities of PLAXIS to conceptually model and analyze the stability of the site in 3D lead to a more effective digital twin of the earth structure. We provide training to allow the system to be utilized by owner/operators or consultants. Contact us for more information related to your particular application!
Learn more about PLAXIS with Virtuosity:
Learn 6 Reasons Why You Should Use PLAXIS for Geotechnical Analysis Project. Read here
Want to learn the specialized material models in PLAXIS 2D and 3D? Read here.
For the price and the amount of Keys included in PLAXIS Virtuoso Subscription, please visit PLAXIS.
Interested in this topic but didn't find the answers you are looking for? Contact a PLAXIS expert now. We are here to help.